Scientific Studies & Academic Presentations

Explore a portfolio of empirical research, spatial modeling, and climate econometrics. This collection features full academic manuscripts, literature reviews, and interactive slide decks spanning ecology, hydrology, public health, and agricultural economics.

Filter:
Global Habitat Suitability Modeling for an Invasive Species: Japanese Beetle (Popillia japonica)
Full Screen
1. Ecological Modeling & Invasive Species Risk

Global Habitat Suitability Modeling for an Invasive Species: Japanese Beetle (Popillia japonica)

MaxEnt Species Distribution Modeling Invasive Species Ecology Climate Projections (RCP 4.5) iNaturalist Data Processing
Study Overview

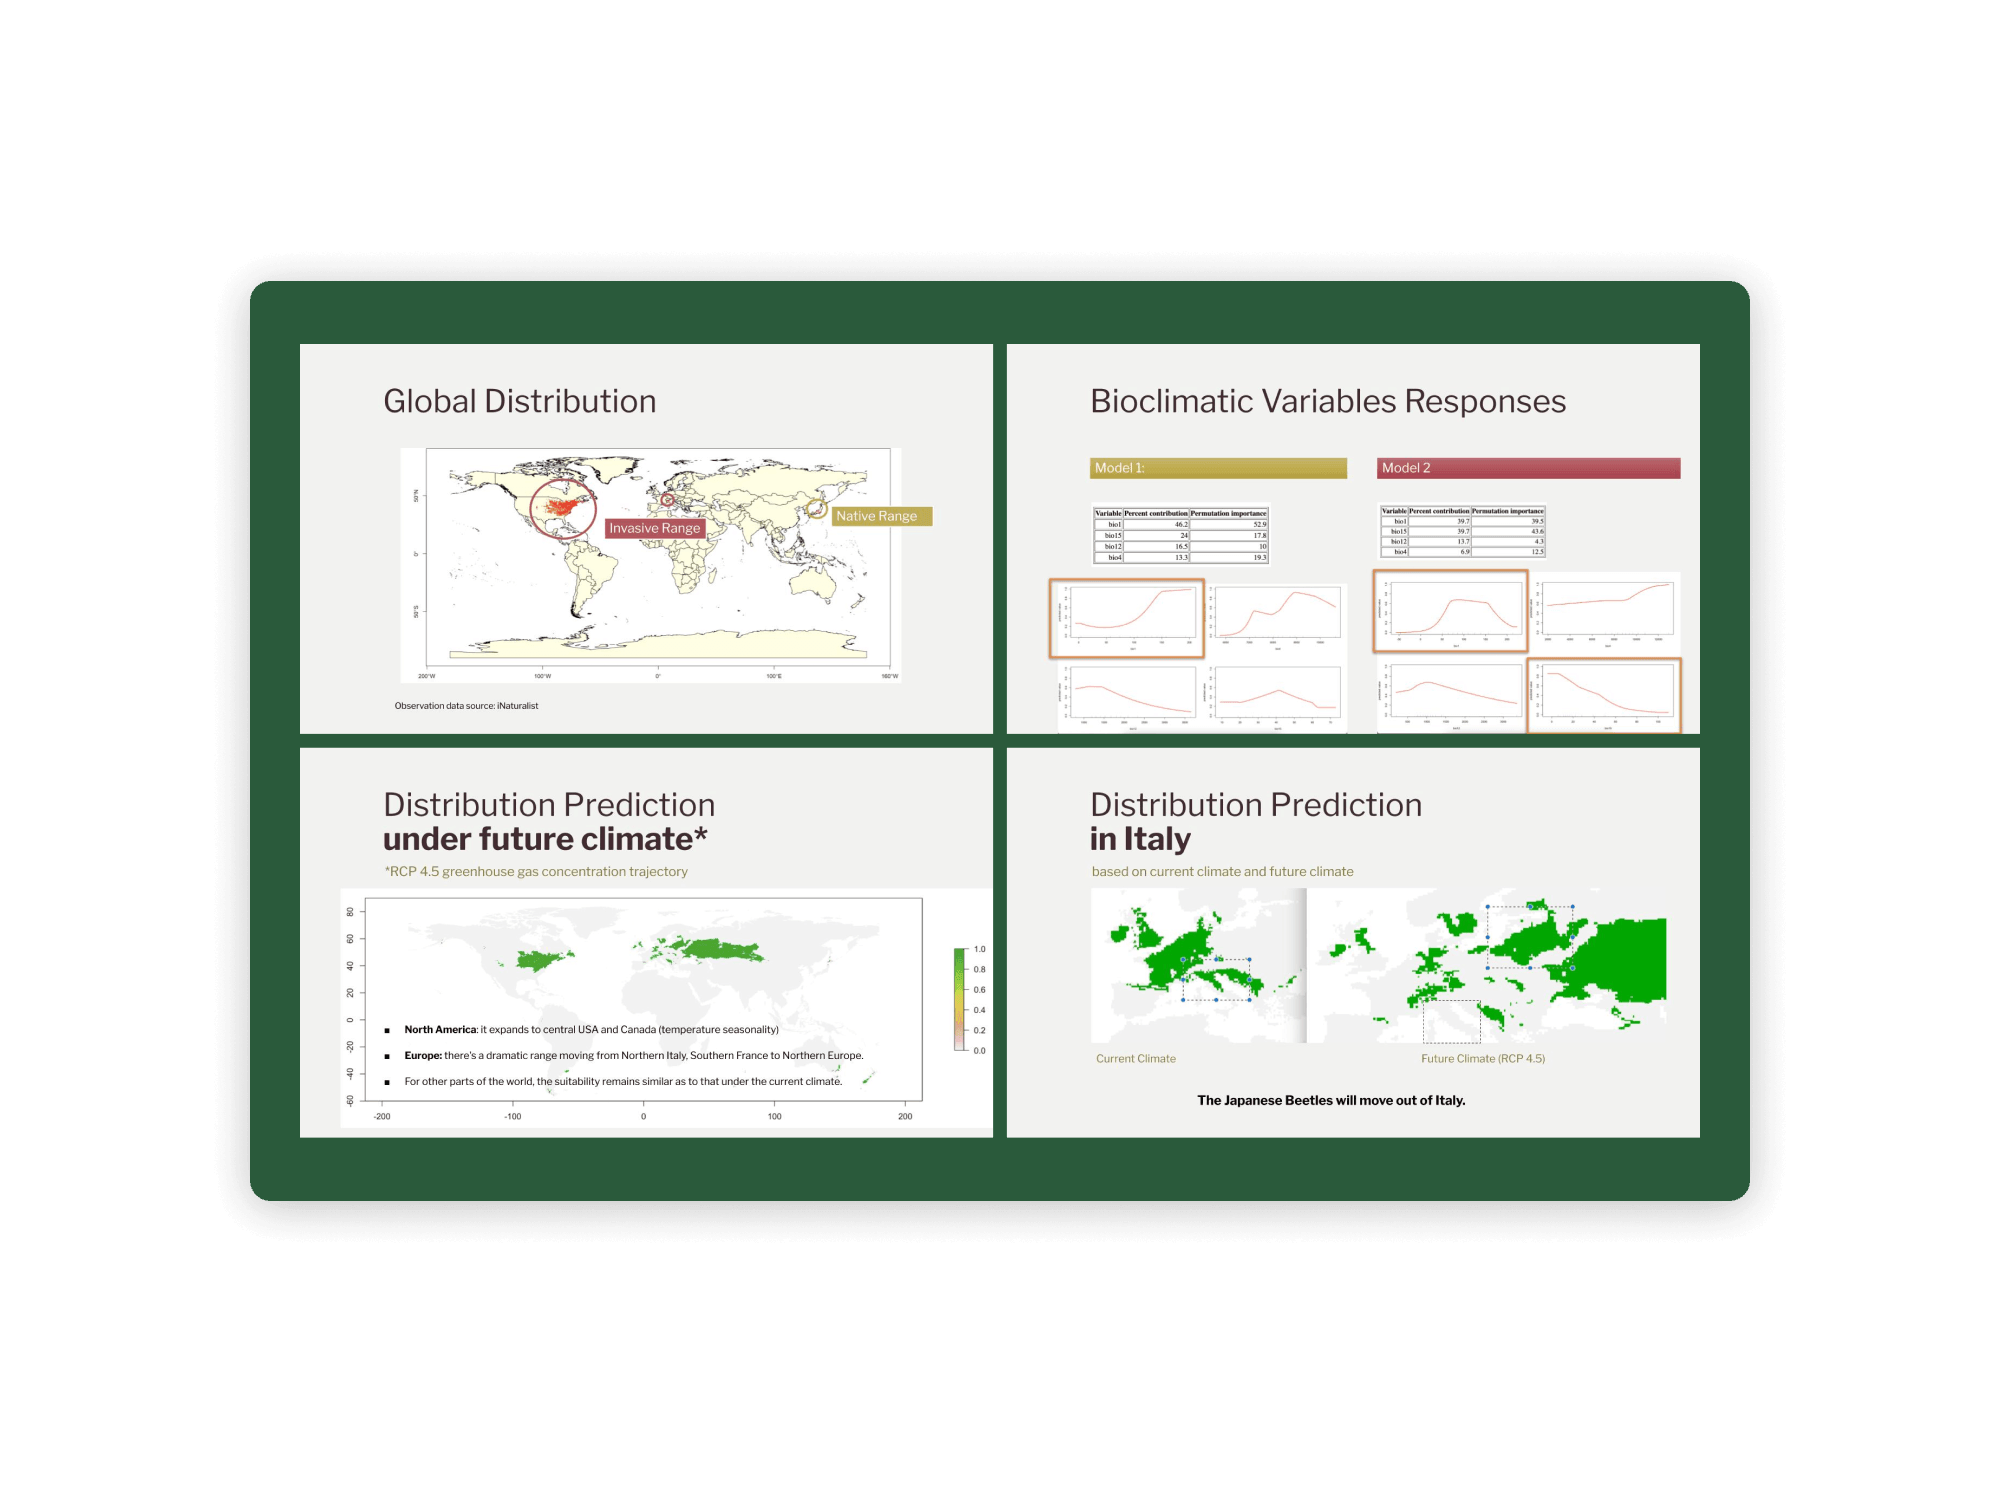
Evaluated current and projected global habitat suitability for the invasive Japanese Beetle (Popillia japonica) using Maximum Entropy (MaxEnt) species distribution modeling. By integrating crowdsourced occurrence data from iNaturalist with key bioclimatic variables, the study compared native-to-invasive model transferability against a global random-split validation strategy. Under current climate conditions, high suitability was identified in the Eastern USA and Northern Italy (Milan/Lombardy region). Under the RCP 4.5 greenhouse gas trajectory, projections indicate a major range expansion into Central USA and Canada, alongside a dramatic shift in Europe where the species is projected to move out of Italy toward Northern Europe.

Skills & Key Highlights
  • MaxEnt Modeling & Strategy Validation: Implemented Maximum Entropy species distribution modeling in MaxEnt, comparing a native-trained model (AUC = 0.468) against a global 80/20 train/test split model (AUC = 0.71) to demonstrate the necessity of pooled occurrence data for invasive species predictions.
  • Eco-Physiological Risk Mapping: Analyzed bioclimatic variable response curves against known physiological thresholds of P. japonica, including thermal activity limits (21°C to 35°C), relative humidity constraints (60%), and moisture requirements for larval development.
  • Climate Scenario Forecasting: Projected spatial distribution shifts under the RCP 4.5 emission scenario, forecasting that changing temperature seasonality will push the species out of its current Italian hotspot and drive expansion into higher latitudes across Europe and North America.
  • Biodiversity Data Integration: Extracted, filtered, and processed global occurrence records from iNaturalist to establish training and testing datasets across native and invasive ranges.
Dendrobates tinctorius habitat reclassification and IUCN assessment
Full Screen
2. Biodiversity & Species Conservation

Habitat Loss & IUCN Red List Assessment: Dendrobates tinctorius

Spatial Land-Use Reclassification RStudio Area of Occupancy (AOO) IUCN Red List Assessment
Study Overview

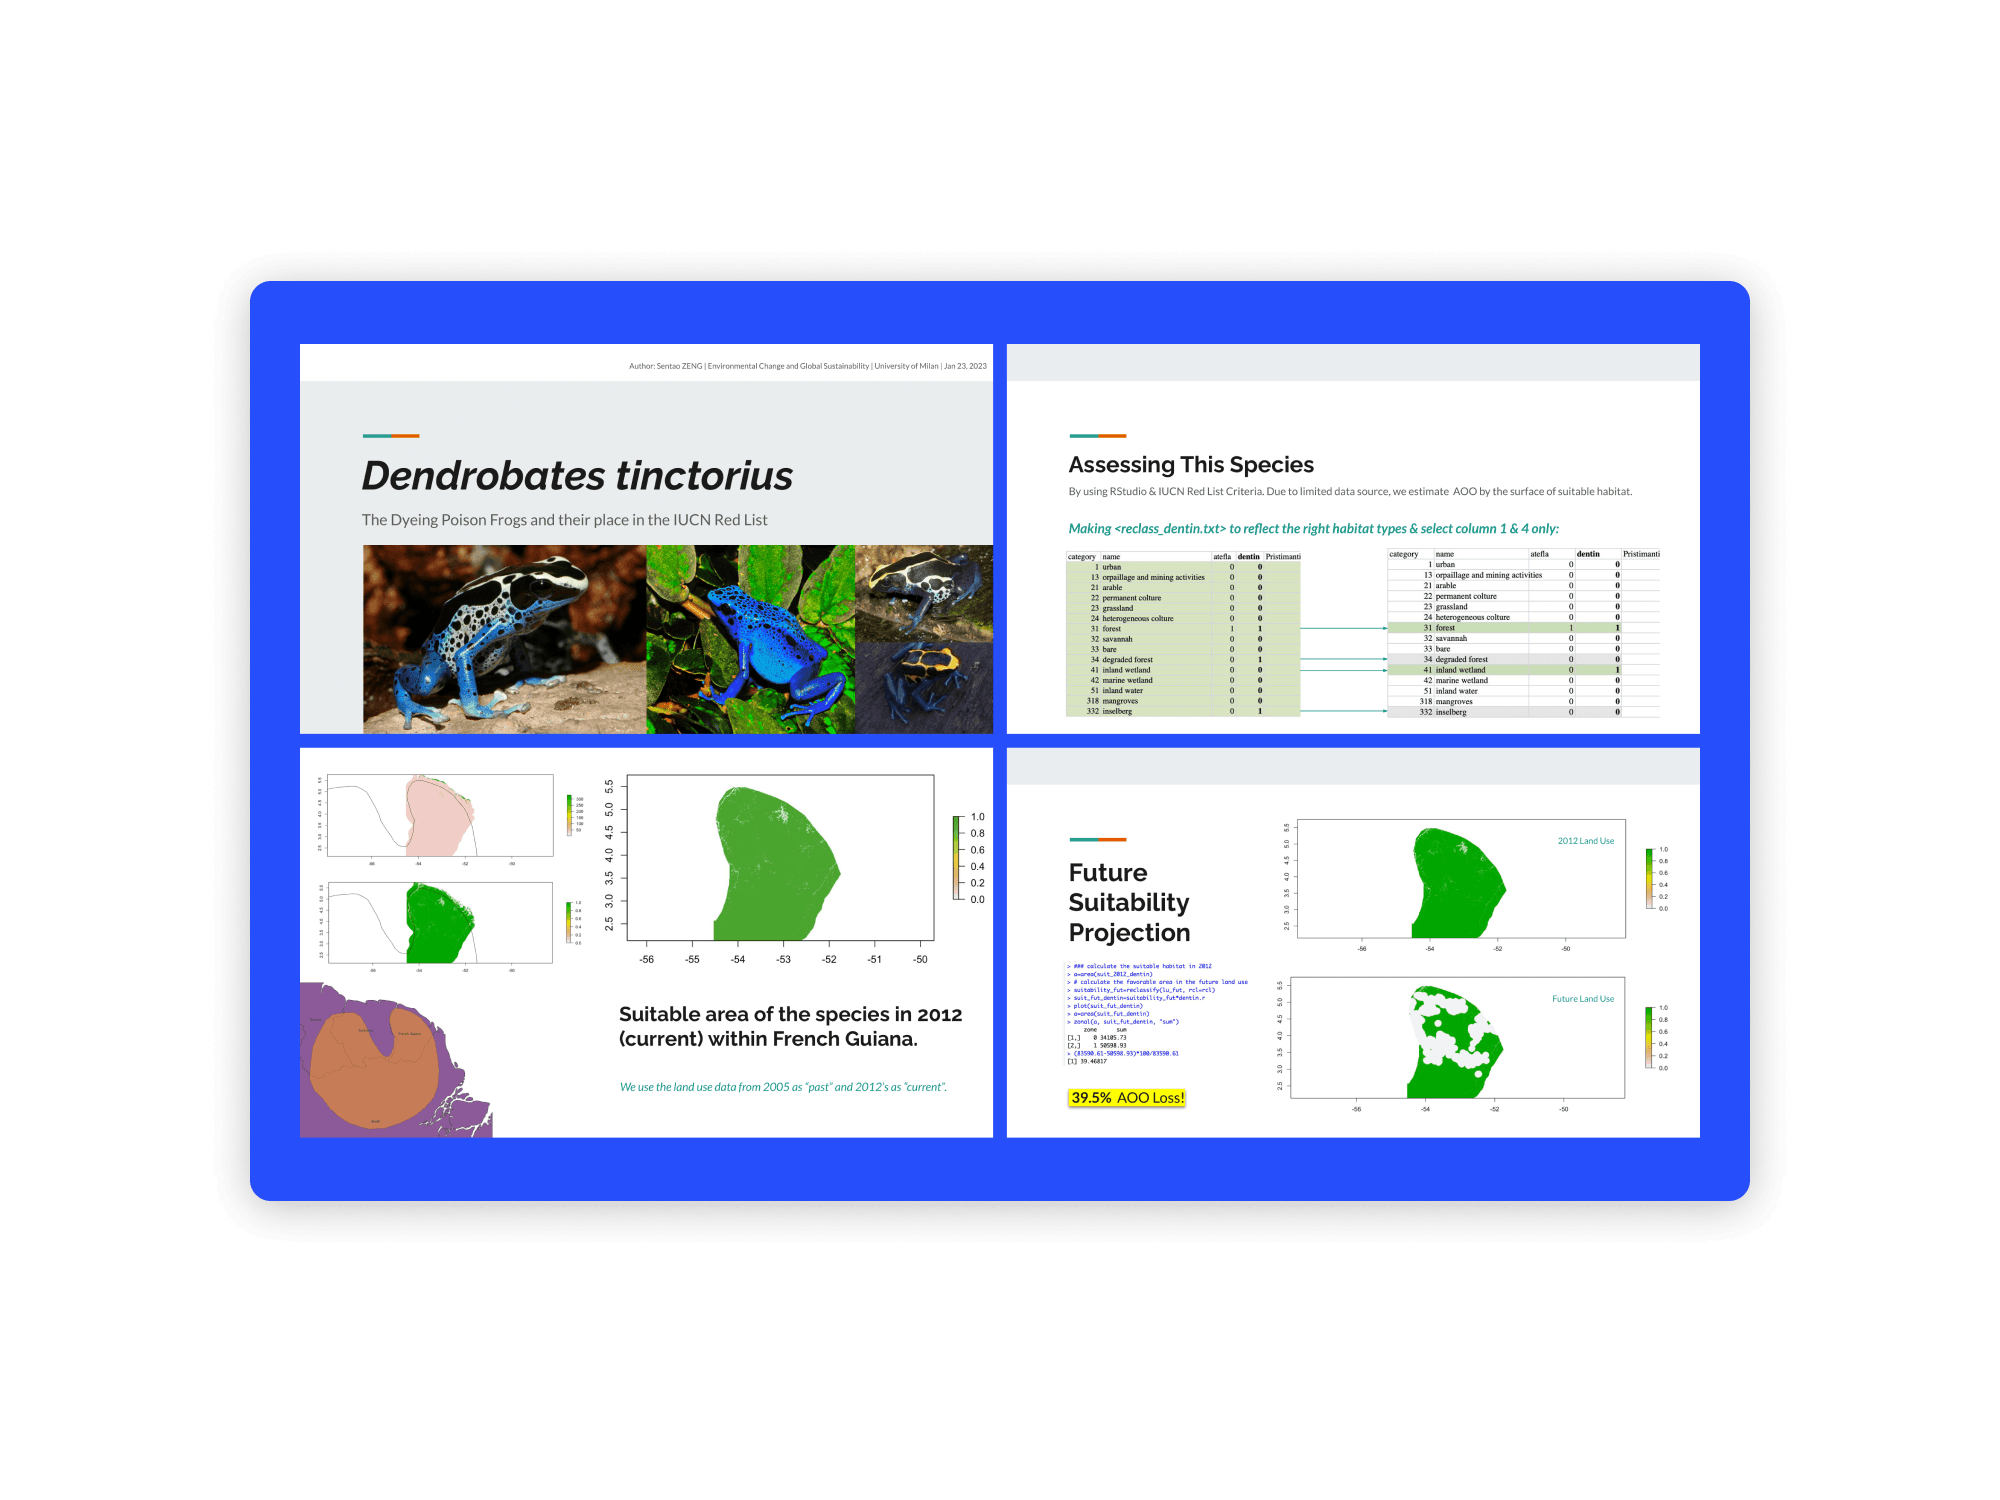
Evaluated historical and projected land-use impacts on the Area of Occupancy (AOO) for the Dyeing Poison Dart Frog (Dendrobates tinctorius) across French Guiana. Using RStudio to process spatial land-use datasets and custom reclassification matrices (<reclass_dentin.txt>), the study estimated suitable habitat surfaces across past (2005), current (2012), and future land-use scenarios. While historical habitat loss between 2005 and 2012 was minimal at under 0.2%, future projections indicate a 39.5% AOO loss, justifying a proposed IUCN Red List status reclassification to Near Threatened (NT) under future population reduction criteria.

Skills & Key Highlights
  • Spatial Data Reclassification in RStudio: Scripted custom reclassification files (<reclass_dentin.txt>) in RStudio to filter suitable habitat categories (e.g., forest, inland wetlands, inselbergs) from non-suitable land-use types (e.g., urban, mining, arable land).
  • AOO & Suitable Habitat Estimation: Quantified the species' Area of Occupancy (AOO) by calculating surface area changes across raster land-use maps for 2005 (past), 2012 (current), and future land-use projections.
  • IUCN Red List Quantitative Assessment: Evaluated species extinction risk against IUCN Red List criteria, demonstrating that a projected 39.5% future AOO reduction moves the species toward a "Vulnerable" threshold and supports a Near Threatened (NT) recommendation.
Qinghai Lake Landsat multi-decadal water surface analysis
Full Screen
3. Satellite Remote Sensing & Hydrology

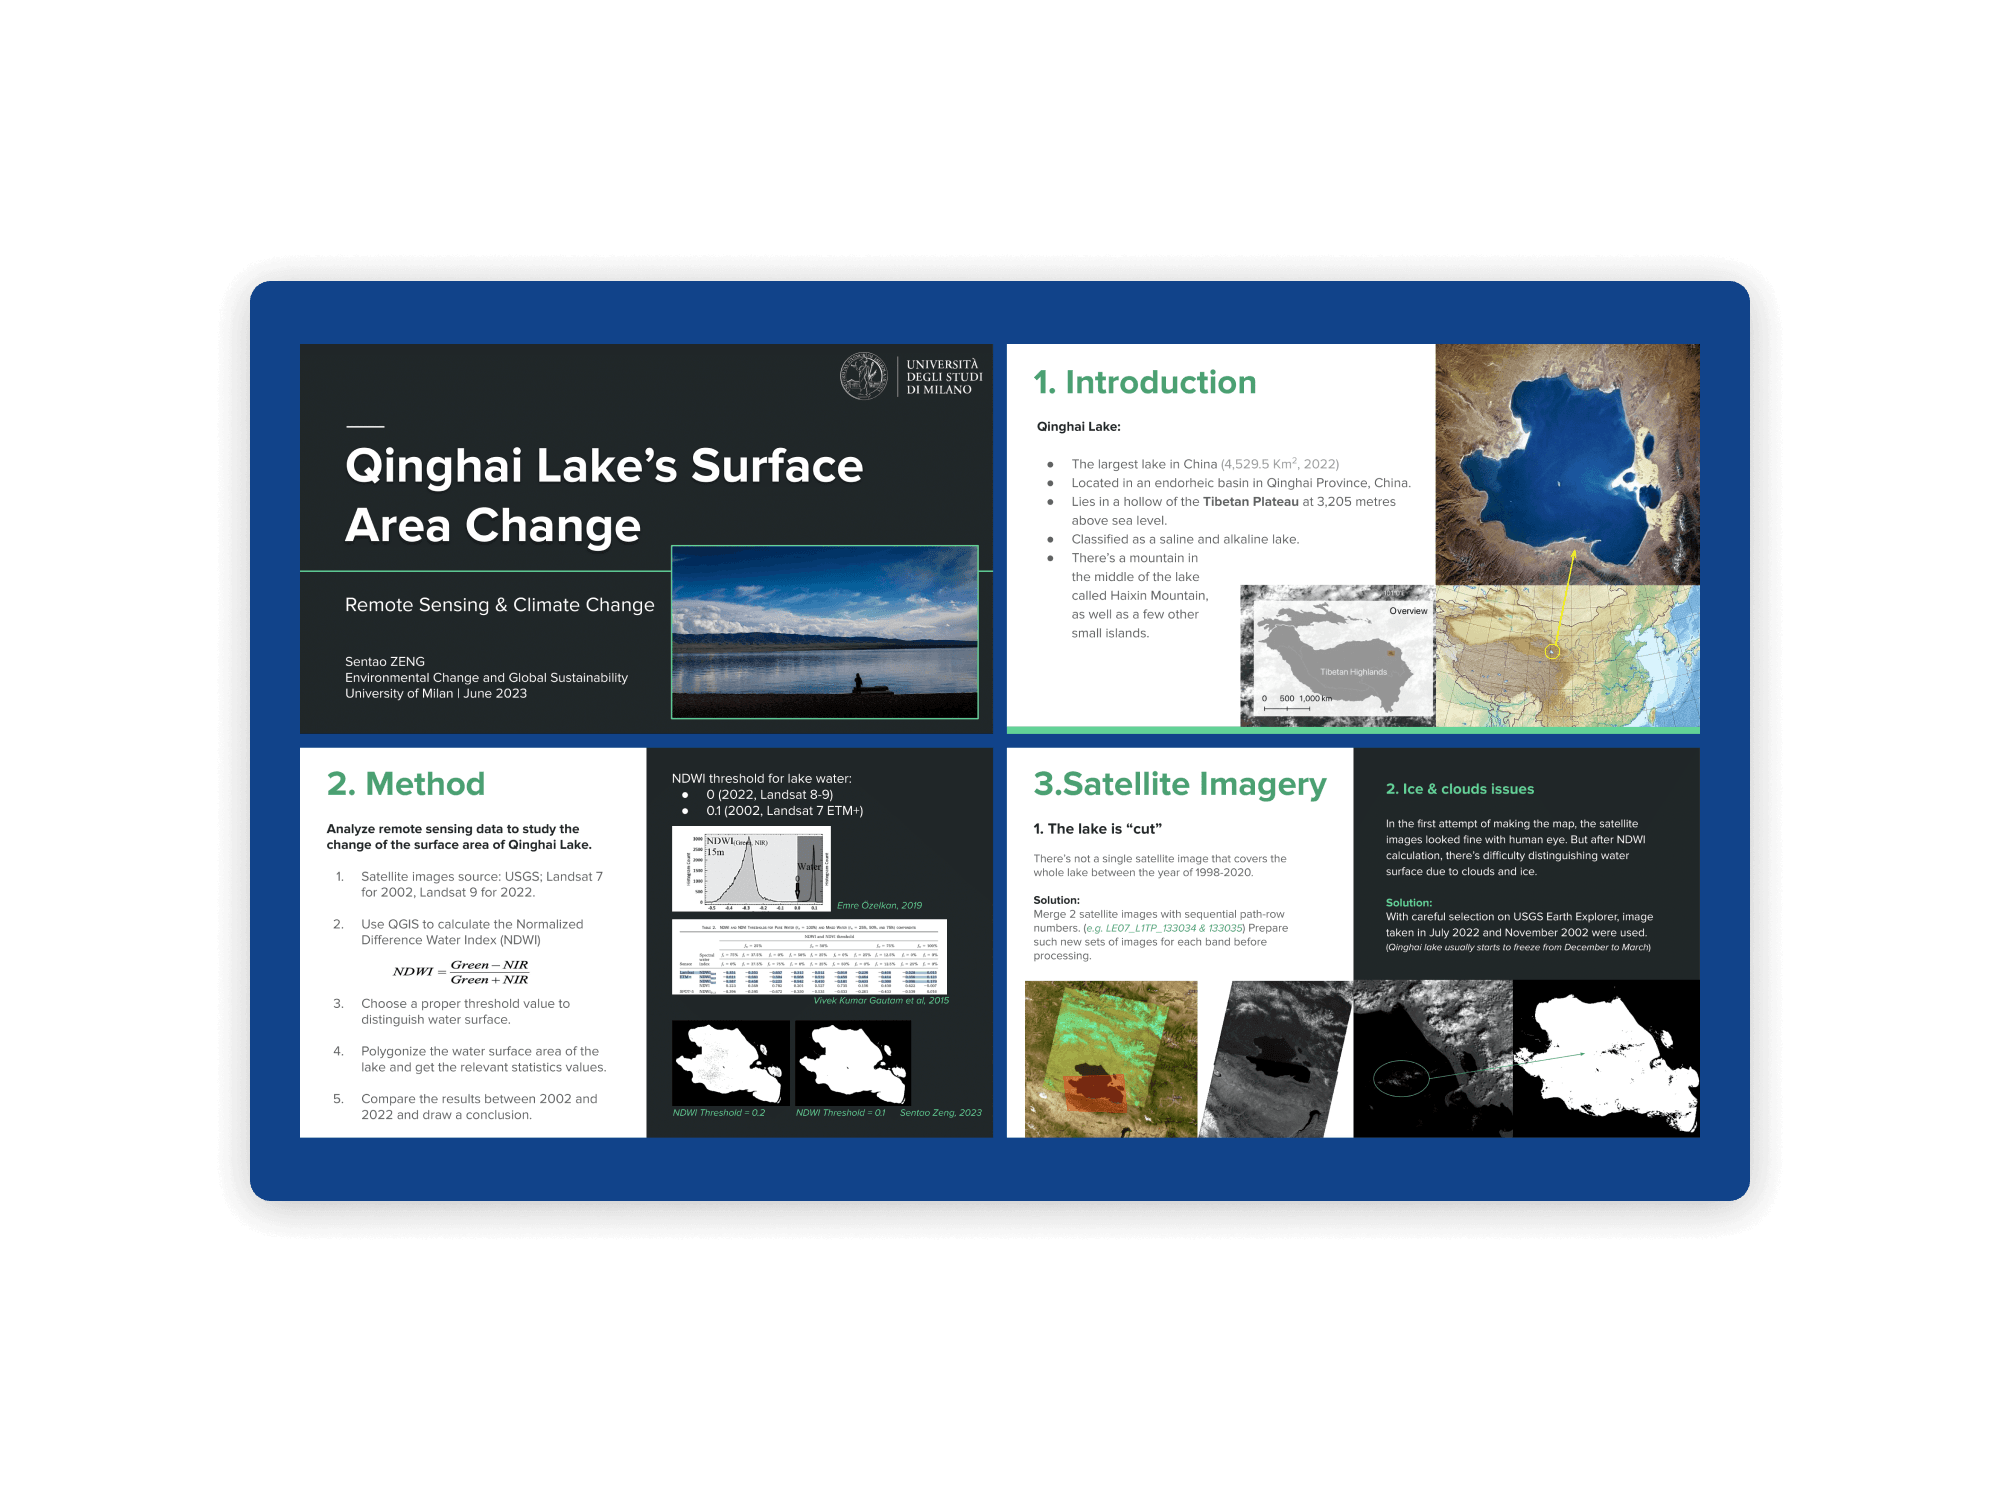
Multi-Decadal Surface Area Dynamics of Qinghai Lake

Remote Sensing QGIS Landsat Satellite Imagery NDWI Hydro-Analysis
Study Overview

Quantified a 10.49% expansion (4,099.40 km² to 4,529.52 km²) of Qinghai Lake—China’s largest endorheic saline lake—over a 20-year period (2002–2022) using Landsat 7 ETM+ and Landsat 9 satellite data. The analysis integrated multi-band image stitching, cloud/ice mitigation, and Normalized Difference Water Index (NDWI) thresholding to evaluate climate-driven hydrological shifts.

Skills & Key Highlights
  • Multi-Sensor Satellite Processing: Merged sequential path-row Landsat scenes (LE07_L1TP) to resolve coverage gaps and screened acquisition dates to eliminate seasonal ice/cloud interference.
  • Index-Based Surface Extraction: Applied sensor-specific NDWI thresholds (0.1 for Landsat 7; 0.0 for Landsat 8/9) to segment water bodies from surrounding terrain.
  • GIS Polygonization & Spatial Statistics: Executed vector polygonization in QGIS to compute surface area trends, linking lake expansion to rising precipitation and declining daily temperature ranges.
PM2.5 and child mortality panel econometrics regression curves
Full Screen
4. Applied Econometrics & Public Health

Global PM2.5 Air Pollution and Child Mortality Econometric Model

STATA Panel Data Analysis Fixed Effects (reghdfe) Environmental Economics
Study Overview

Investigated the empirical relationship between population-weighted ambient PM2.5 exposure and under-five child mortality using a global panel dataset covering 216 countries and territories from 1960 to 2022. Implemented high-dimensional fixed-effects models and log-log specifications in STATA to control for macro-level economic development (GDP per capita) and country-specific unobserved heterogeneity.

Skills & Key Highlights
  • High-Dimensional Panel Econometrics: Executed reghdfe linear and quadratic fixed-effects regressions controlling for country-specific and year fixed effects.
  • Non-Linear & EKC Testing: Modeled Environmental Kuznets Curve (EKC) dynamics to prove that omitting GDP per capita overestimates the health impacts of PM2.5 by over 20%.
  • Logarithmic Data Transformation: Addressed severe right-skewness across global datasets using natural log transformations (ln), improving model within-R² explanatory power from 0.89–0.90 to 0.98.
Phytoremediation mechanisms and rhizobacteria interactions diagram
Full Screen
5. Environmental Remediation & Biotechnology

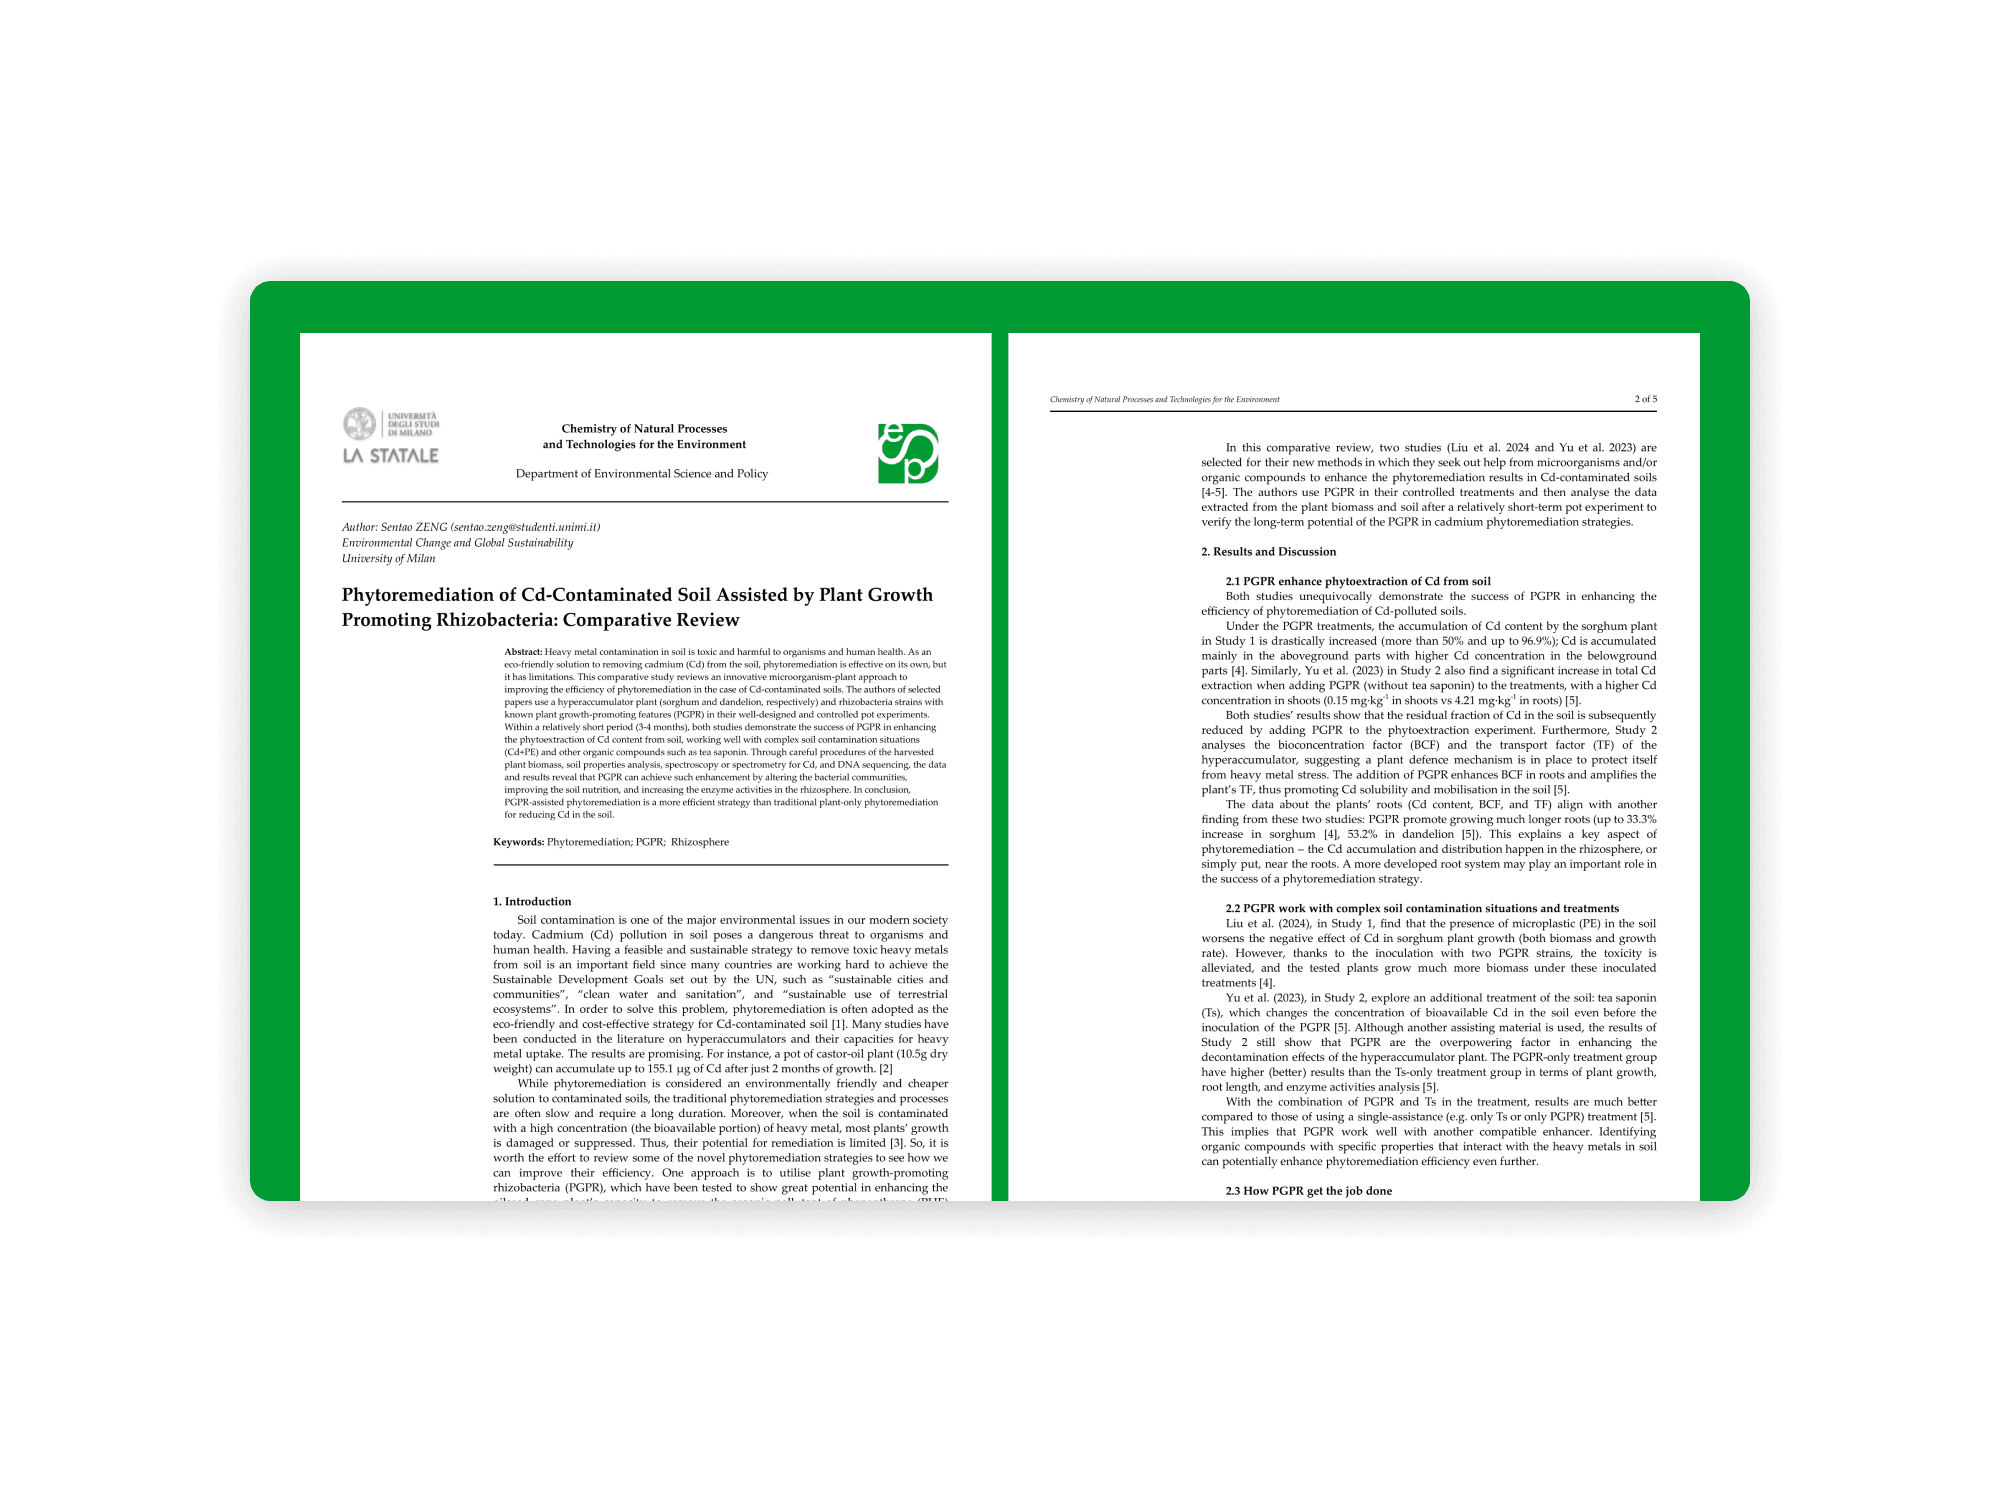
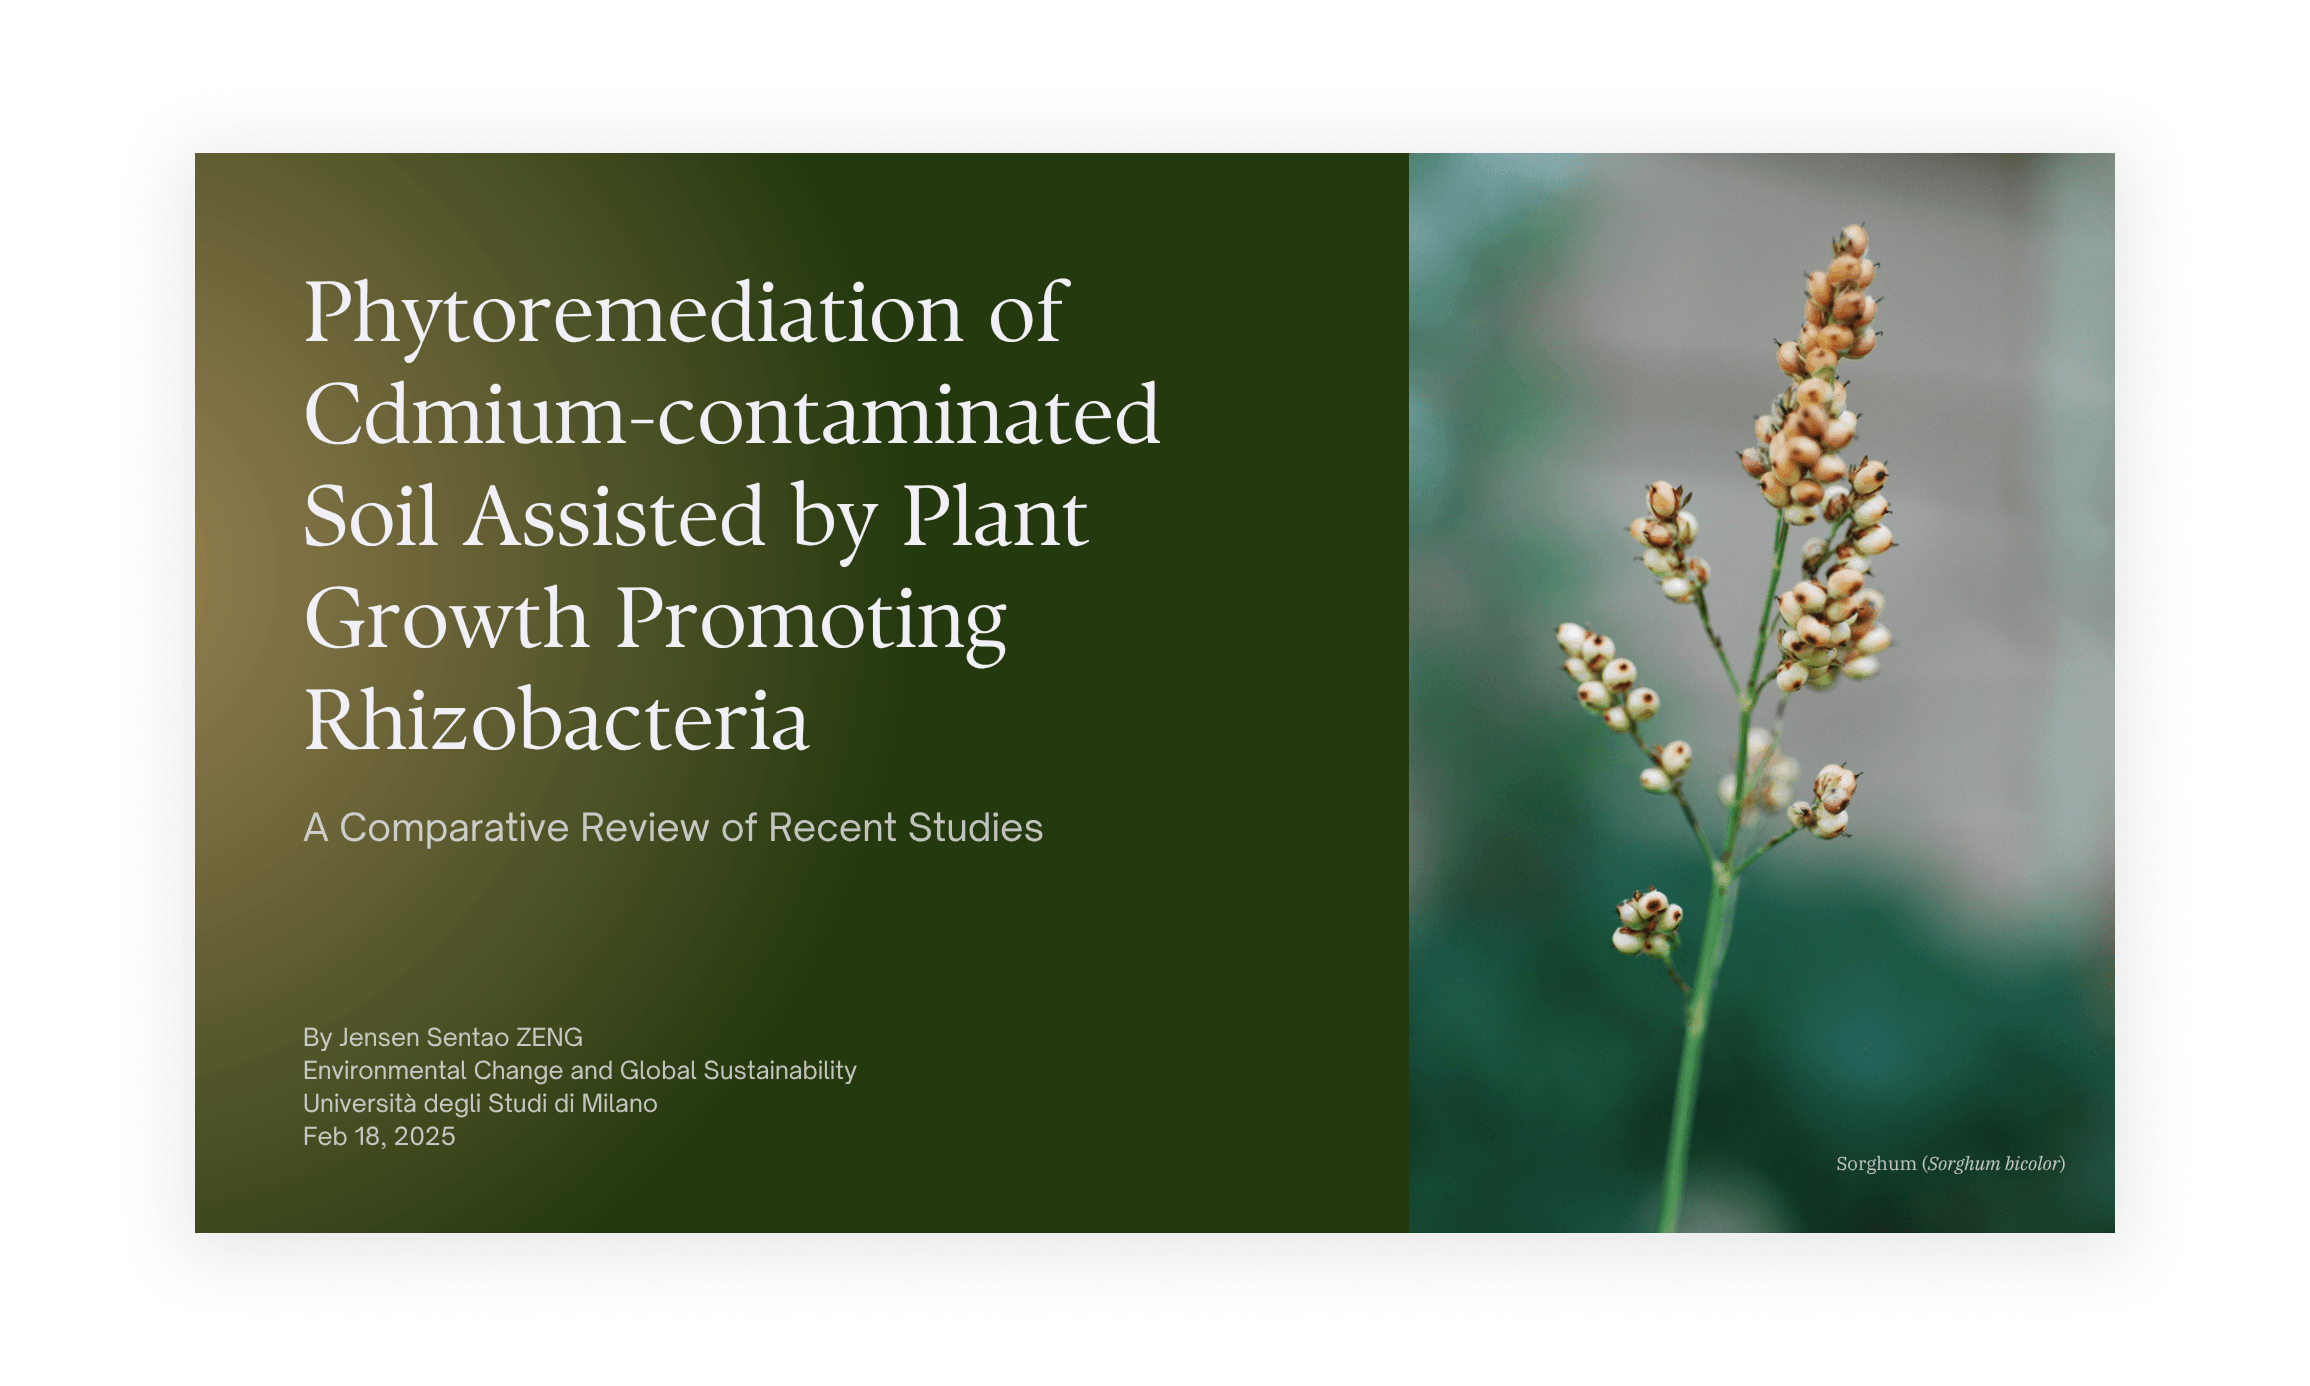
PGPR-Assisted Phytoremediation of Cadmium-Contaminated Soils

Biotechnology Rhizosphere Chemistry SciFinder-n / Minerva Comparative Review
Study Overview

Synthesized cutting-edge experimental research on bio-assisted phytoremediation, evaluating how Plant Growth-Promoting Rhizobacteria (PGPR) strains (e.g., Bacillus, Burkholderia) enhance heavy metal (Cd) uptake in hyperaccumulators like sorghum and dandelion. The comparative review highlights microbial community shifts, enzyme activation, and synergies with biosurfactants (tea saponin).

Skills & Key Highlights
  • Systematic Literature Screening: Conducted targeted bibliographic queries across SciFinder-n and Minerva databases using Boolean filters, screening 324 high-impact studies down to core experimental papers.
  • Analytical Method Evaluation: Analyzed spectroscopic (ICP-OES, GFAAS) and molecular (PCR amplification, Illumina MiSeq DNA sequencing) techniques used to measure Cd translocation and microbial diversity.
  • Rhizosphere Mechanism Synthesis: Evaluated bioconcentration factors (BCF), transport factors (TF), root length expansions (+33% to +53%), and antioxidant enzyme activities (CAT, POD) under co-contamination conditions (Cd + microplastics PE).
CMIP6 regional temperature anomaly projections chart
Full Screen
6. Climate Modeling & Scenario Analysis

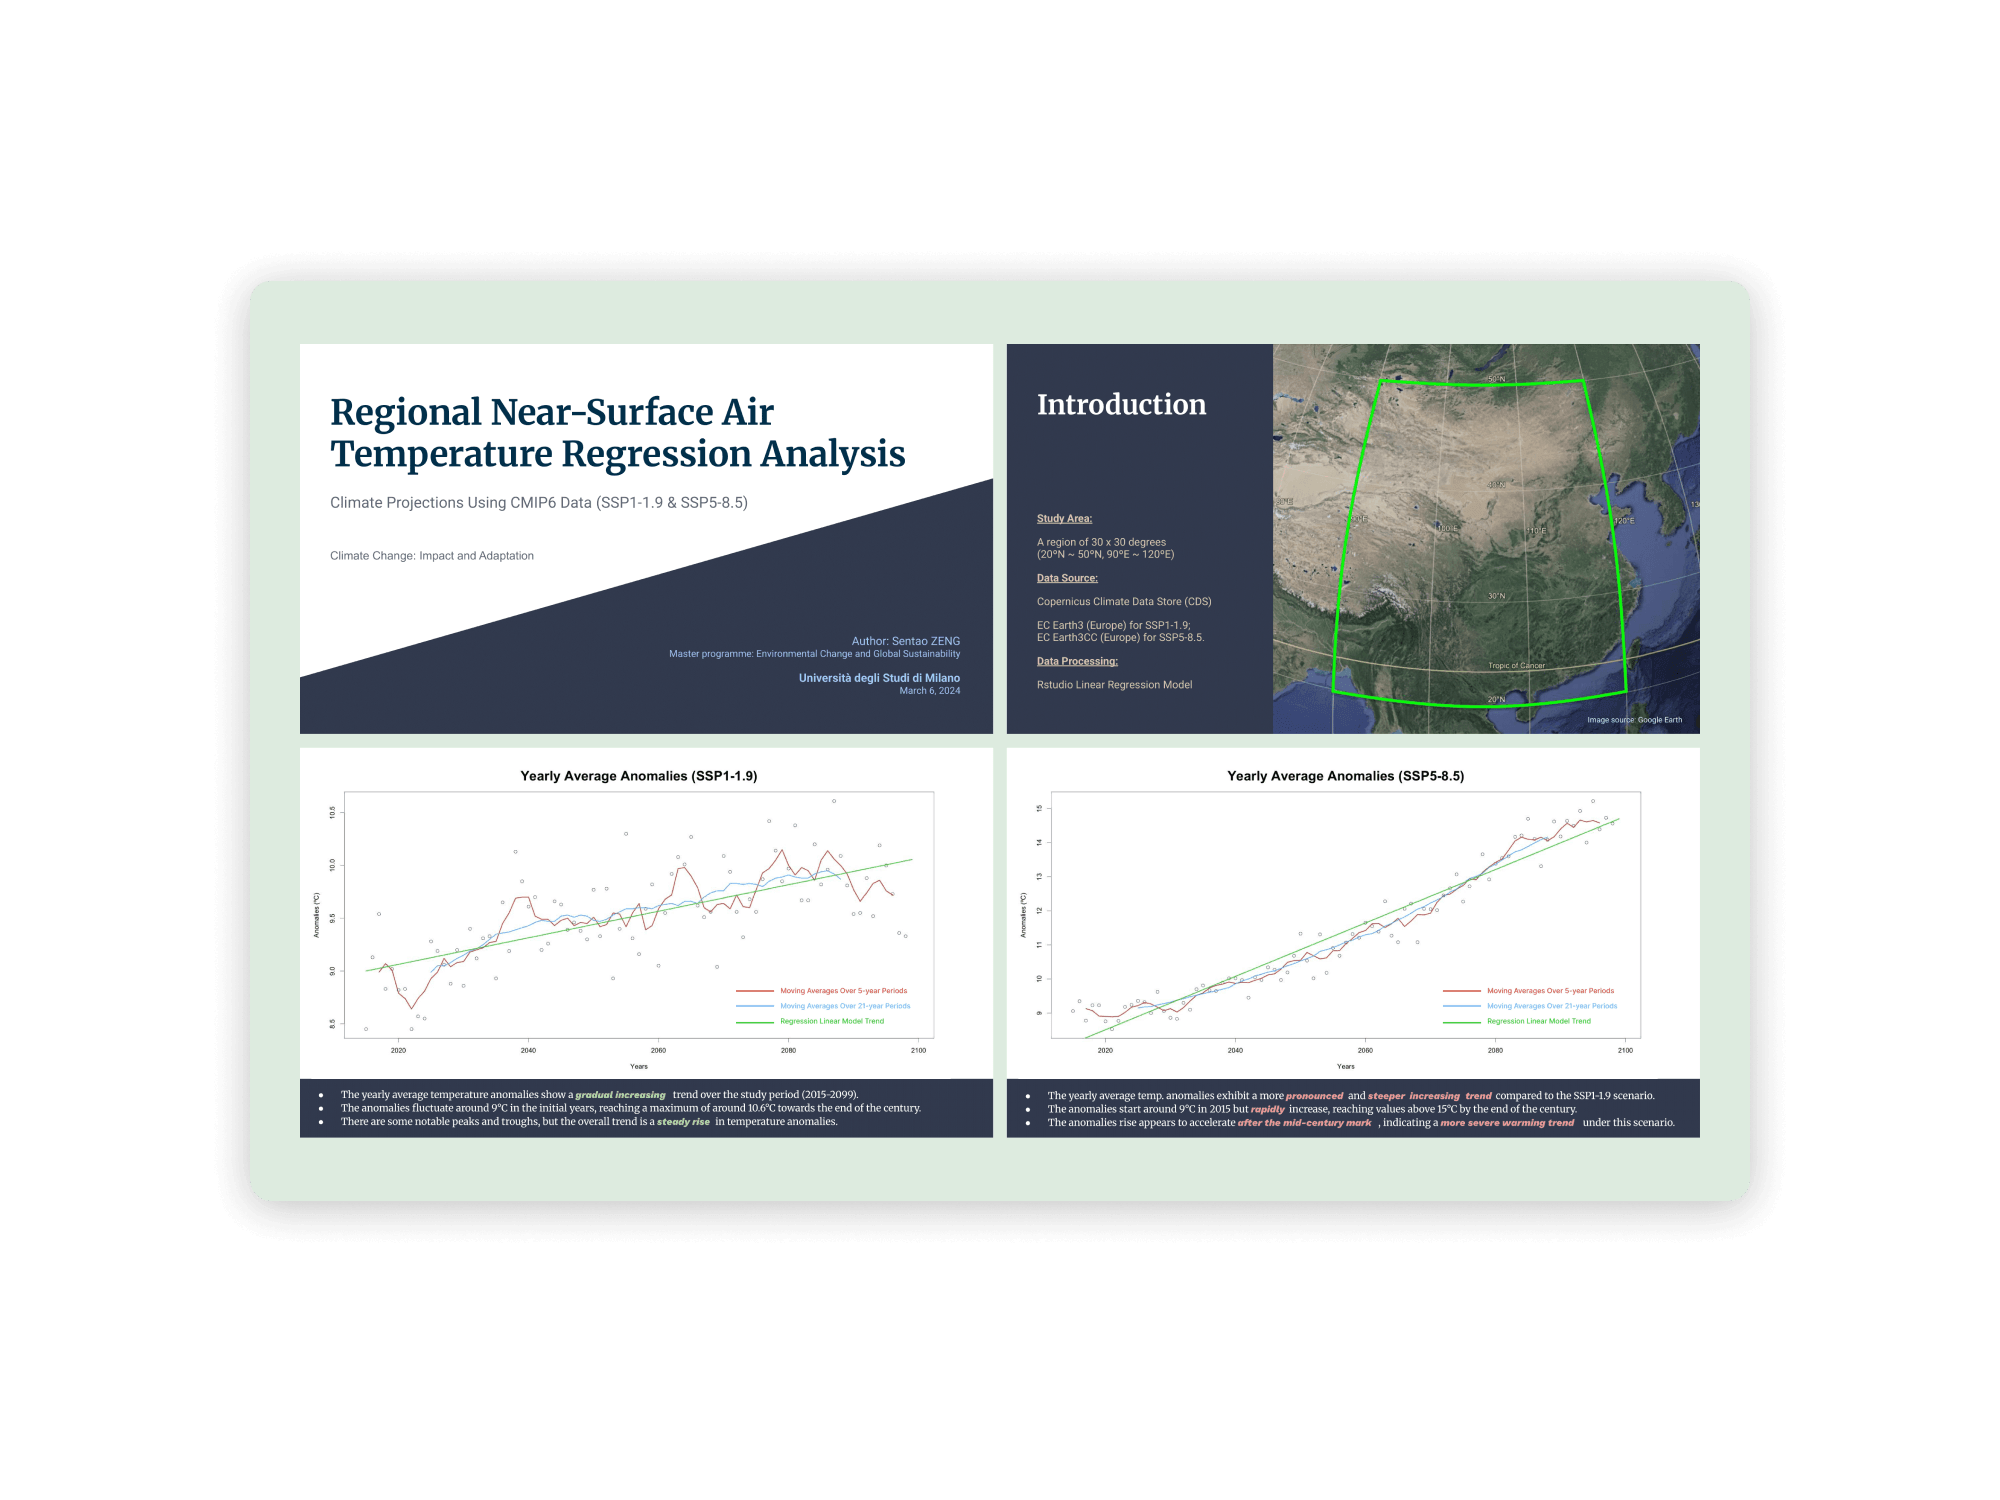
Regional Near-Surface Air Temperature Projections (CMIP6 Data)

CMIP6 Climate Projections Copernicus CDS RStudio Time-Series
Study Overview

Modeled future near-surface air temperature anomalies across a 30°×30° East Asian domain (20°N–50°N, 90°E–120°E) from 2015 to 2099. Extracted global climate model output (EC-Earth3 and EC-Earth3CC) from the Copernicus Climate Data Store (CDS) to evaluate warming trajectories under low-emissions (SSP1-1.9) versus high-emissions (SSP5-8.5) Shared Socioeconomic Pathways.

Skills & Key Highlights
  • NetCDF & Climate Data Extraction: Processed high-resolution climate projection data from Copernicus CDS for CMIP6 multi-model ensembles.
  • Regression & Moving Averages: Fitted linear trendlines and calculated 5-year and 21-year moving averages in RStudio to isolate long-term climate signals from interannual variability.
  • Scenario Comparative Analysis: Demonstrated a moderate warming trend under SSP1-1.9 (~9°C to ~10.6°C) versus an accelerated warming trajectory exceeding +15°C anomalies by 2100 under SSP5-8.5.
Tuscan wine viticulture climate econometrics and hedonic pricing map
Full Screen
7. Master's Thesis: Climate Econometrics & Agribusiness

Tuscan Wine in a Changing Climate: Impact of Extreme Weather on Quality and Price

Climate Econometrics Hedonic Pricing Geospatial Downscaling Master's Thesis
Study Overview

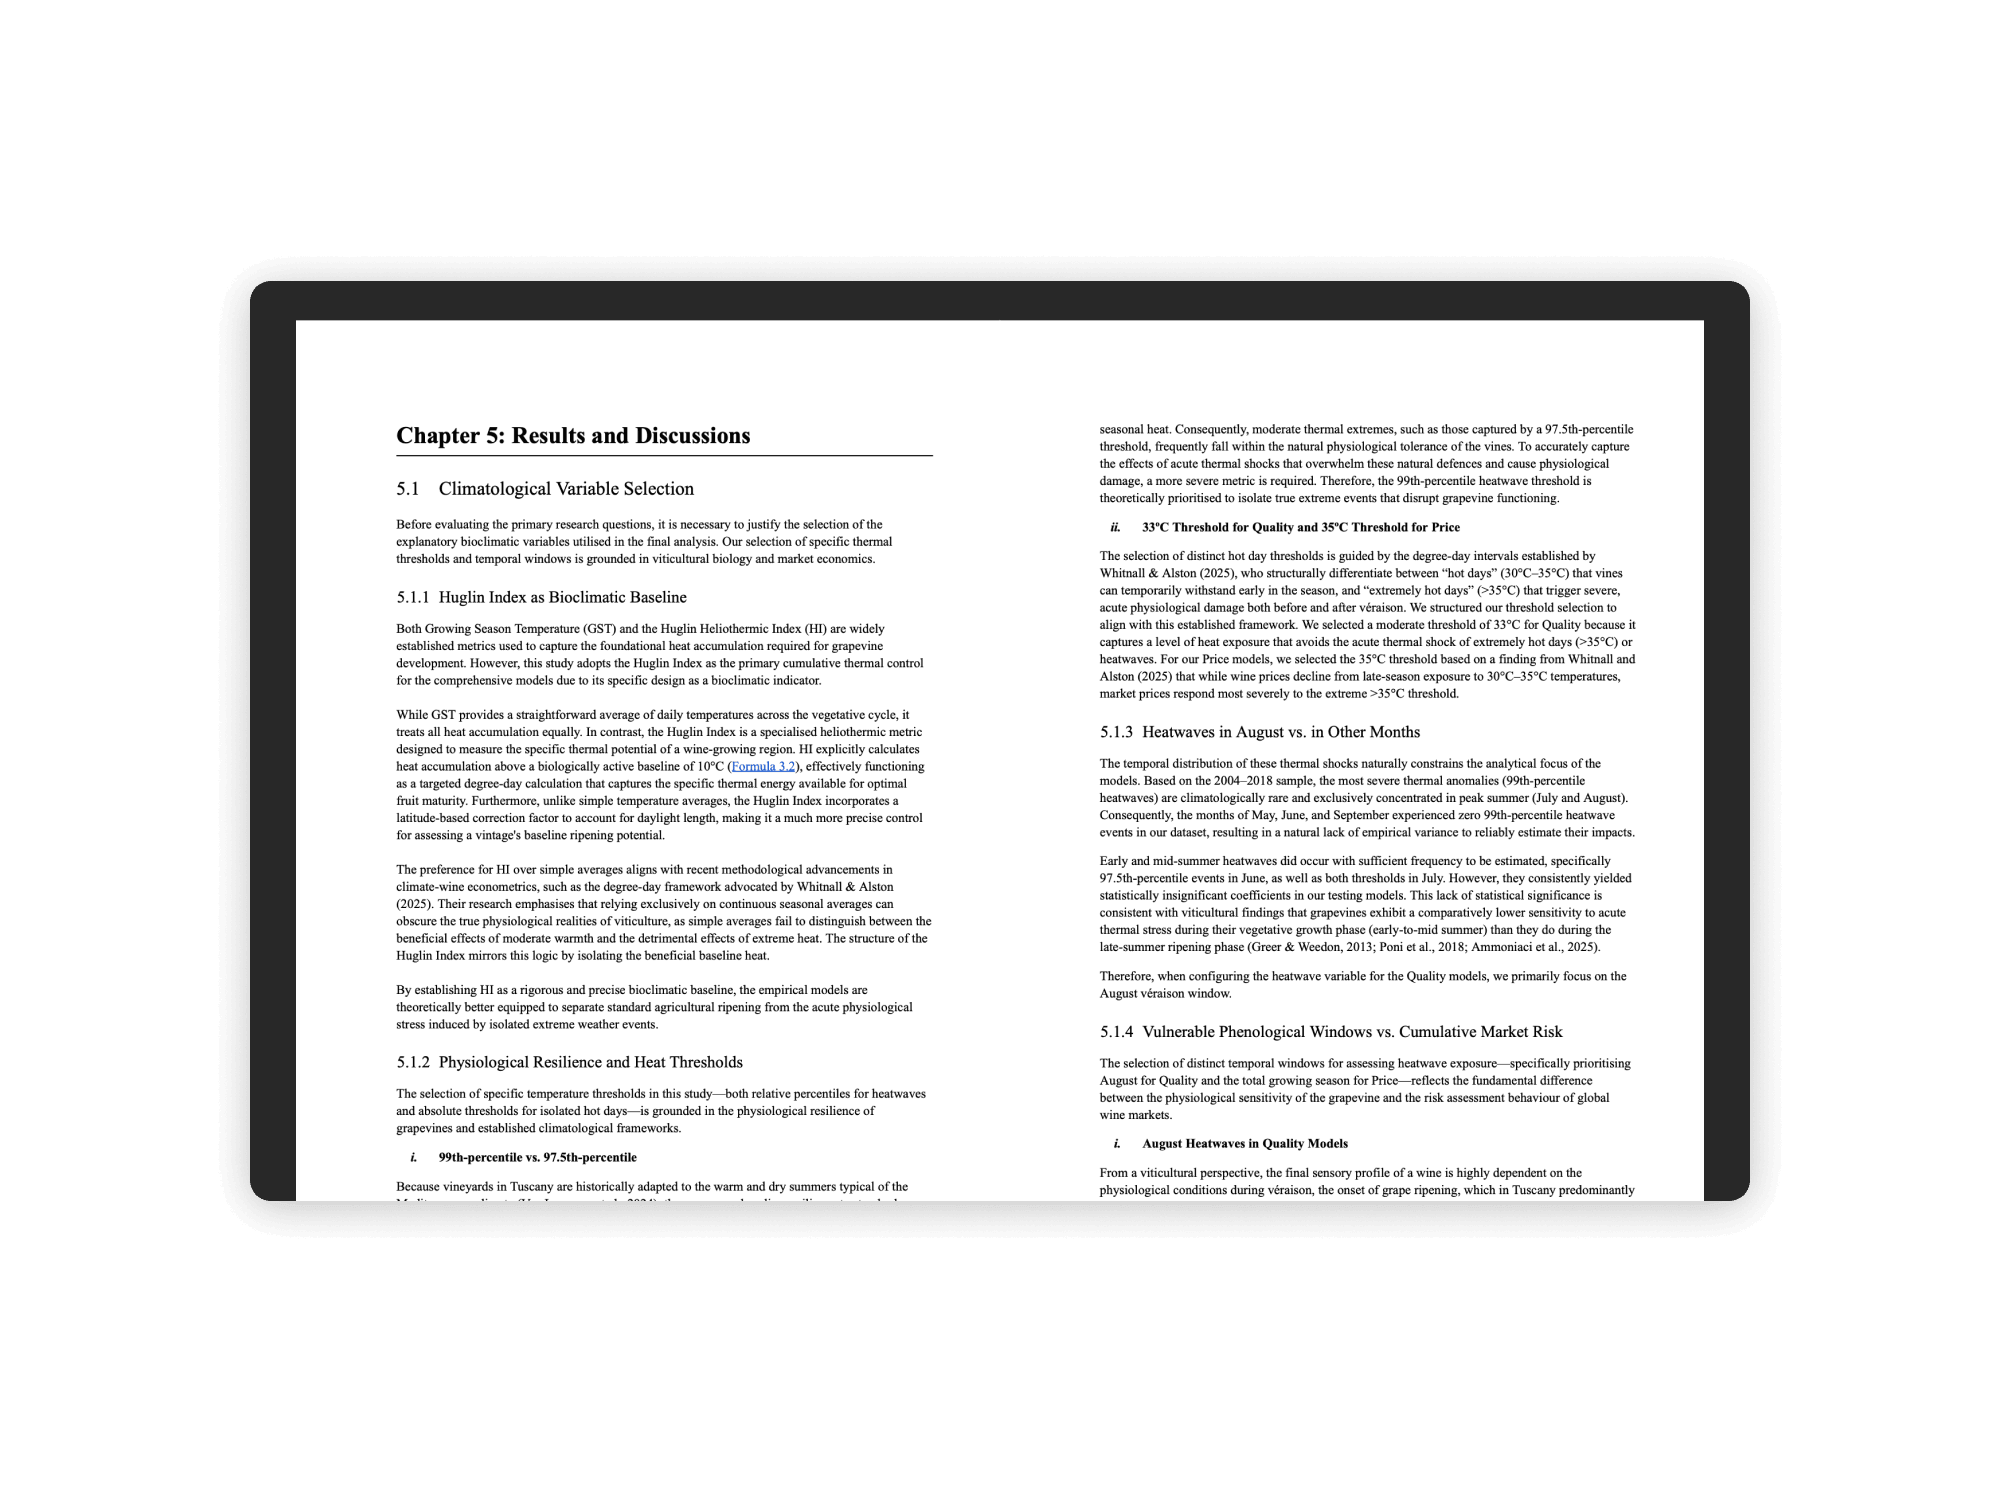
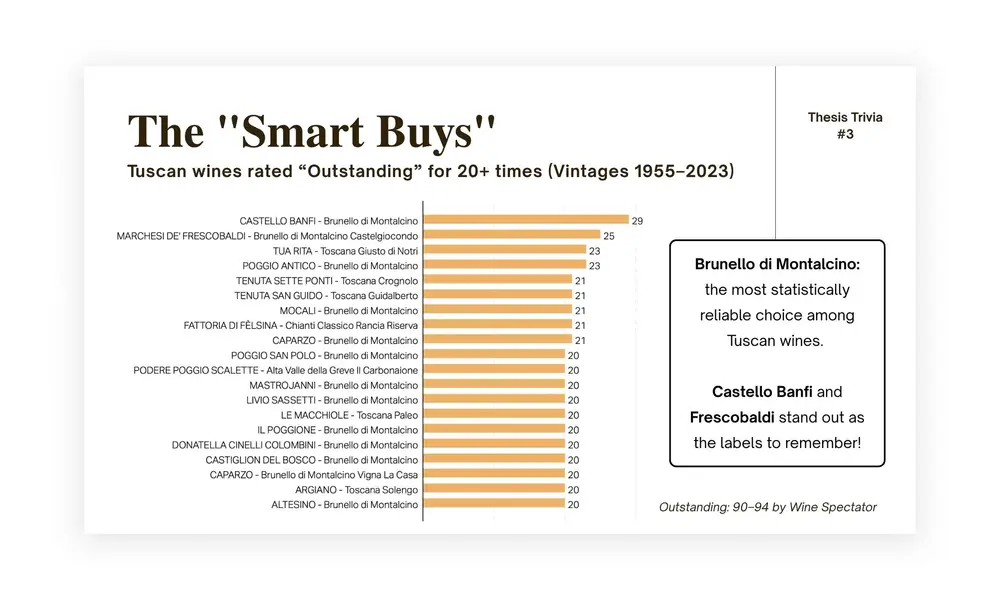
Investigated the economic and sensory impacts of shifting climate baselines and acute thermal shocks on Tuscan viticulture. Constructed a 15-vintage panel dataset (2004–2018; 1,079 observations) combining Wine Spectator expert scores, inflation-adjusted release prices, downscaled ECMWF AgERA5 climate data, and EU Geographical Indication (PDO/PGI) frameworks.

Skills & Key Highlights
  • Vineyard-Weighted Spatial Downscaling: Downscaled AgERA5 gridded daily weather variables to municipality (comune) boundaries, weighted specifically by CORINE Land Cover (CLC 2018) vineyard rasters.
  • Bioclimatic Indexing & Degree-Day Logic: Calculated Huglin Heliothermic Index (HI), Growing Season Temperature (GST), Growing Season Precipitation (GSP), and 99th-percentile heatwave indicators.
  • Hedonic Pricing & Spatial Heterogeneity Analysis: Implemented multi-dimensional panel fixed effects models, discovering an inverted U-shaped thermal optimum (~20°C GST), an August heatwave score penalty, maritime moderating effects in coastal terroirs, and quality buffering under PDO designations.
Interactive Slide Decks

Presentations on Canva:

Explore interactive slide decks, thesis defense materials, and literature reviews prepared for academic defense and research presentation.

Tuscan Wine in a Changing Climate - Thesis Defense Presentation
Thesis Defense

Tuscan Wine in a Changing Climate

The Smart Buys Thesis Trivia
Interactive Quiz

The Smart Buys Thesis Trivia

PGPR Phytoremediation Chemistry Paper Review
Literature Review

PGPR Phytoremediation Paper Review